Application of Acrel-5000 Energy Management System in Lot No. 05 of Hongqiao
1 Introduction
At present, China is already the world’s second largest energy producer and consumer. According to statistics, China’s building energy consumption accounts for about 28% of the country’s total energy consumption. In China’s newly built 2 billion square meters of buildings, 99% of which are It is a high-energy-consuming building; only 4% of the existing buildings have adopted energy-saving measures. Large-scale public buildings not only have high energy density, but also have very serious energy waste. They have huge space for energy conservation. The promotion of building energy-saving is imperative, and energy saving and consumption reduction are the first measures.
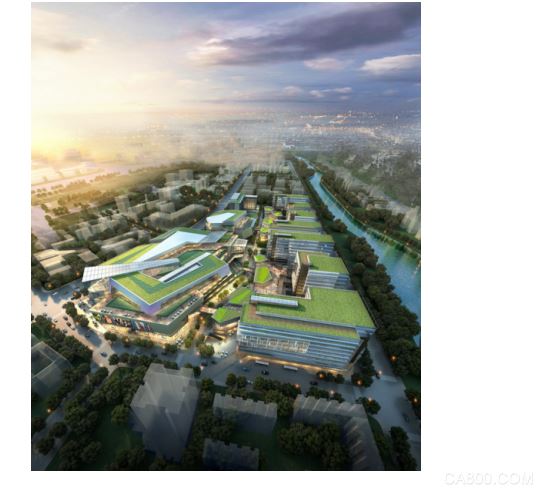
The relevant local regulations require that “building energy consumption monitoring system should be included in the construction plan as part of the new construction equipment and facilities system; the Hongqiao 05 plot project is also called Longhu Hongqiao Tianjie Project. The project is divided into the north and south of Zhouhong Road. The two parcels have a total area of ​​78,700 square meters and a total planned construction area of ​​435,000 square meters, including 251,300 square meters on the ground and 183,600 square meters underground.The Longhu Hongqiao Tianjie Project will have a total area of ​​more than 430,000 square meters. Offices, commercials, and hotel complexes are divided into three major areas in terms of specific functional layout: boutique business and culture and entertainment districts, boutique hotels and hotel auxiliary districts, offices, and distinctive business districts.This project is a large-scale public building. Monitoring design basis is mainly "DGJ68-2068-2012" public building energy monitoring engineering technical specifications.
2, design basis
DGJ08-2068-2012 Shanghai Municipal Public Building Energy Monitoring System Engineering Technical Specification
"Evaluating the rational use of electricity technology guidelines GB"
"General Rules for the Preparation of Energy-saving Planning for Enterprises"
"General Principles of Energy Auditing for Enterprises - GB"
GBT23331-2009 Energy Management System Requirements
GB-50052-2009 "Power Supply and Distribution System Design Specifications"
Energy consumption measurement device national and industrial standards
DL/T 645-1997 Multifunctional Energy Meter Communication Protocol
DL/T 645-2007 multi-function energy meter communication protocol
GB/T 19582-2008 Industrial Automation Network Specification Based on Modbus Protocol
3, system architecture
Acrel-Accor-5000 building energy management system is based on the actual situation of the Shanghai Hongqiao No. 05 plot project site network, the overall network structure is directly connected to the zone collector using shielded twisted pair, and then upload the data to the server through the optical fiber network.
The system mainly adopts a hierarchical distributed computer network structure, as shown in the system structure diagram: station control management layer, network communication layer and field device layer.
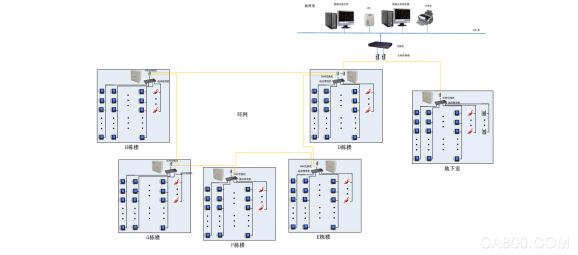
System structure
4, system software module
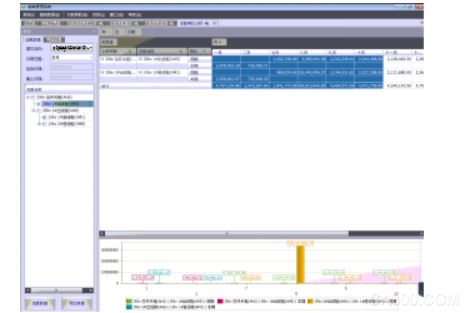
Comprehensive energy consumption main interface
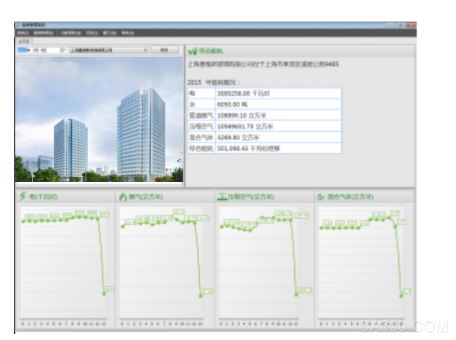
Reflect the energy consumption of each category in the year of the building and convert it into the equivalent energy consumption of standard coal, and calculate the energy consumption per unit area;
Although there are many types of energy consumption in a building, the main energy, water, gas, and renewable energy sources that can be measured by meters are displayed. The energy consumption curve of the four types of energy consumption is displayed on the interface at the bottom of the day; click each The upper area of ​​the classification energy consumption can be jumped to the energy consumption analysis main interface of the classification energy consumption;
The building can be switched through the drop-down box. The building picture can be replaced according to the project requirements;
Classification energy consumption main interface
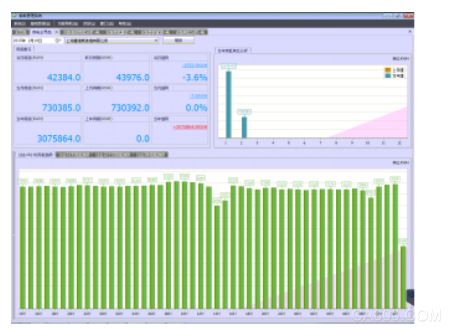
Reflect the energy consumption (for example, electricity) of a certain category and the same period of yesterday, the same period of previous month, the energy consumption and comparison of the same period of the previous month, the same period of the previous month, the current year and the same period of the previous year, the growth percentage and the added value;
Reflect energy consumption trends of the past 48 hours, the past 31 days, the past 12 months, and the past 3 years of a certain classification energy consumption;
The monthly energy pie chart reflecting the energy consumption of a certain item;
Reflecting the energy consumption of a certain category in the same year, the monthly energy use analysis graph;
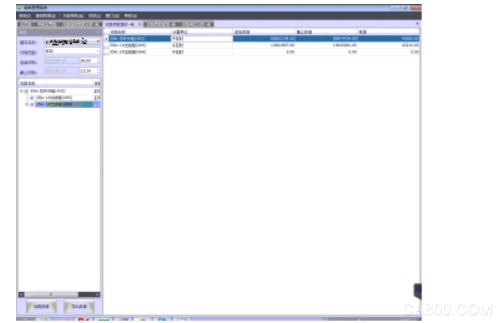
Classification energy consumption branch energy statistics report
The branch can be flexibly selected, and the daily, monthly, weekly, seasonal and annual energy use of branch energy during a certain period of time can be calculated;
Through the powerful function of the pivot table, the user can perform a variety of data statistics and sort the data in combination;
Statistical data can be displayed by various charts such as histograms, dotted charts, stacked charts, and pie charts;
Statistics can be exported to Excel;
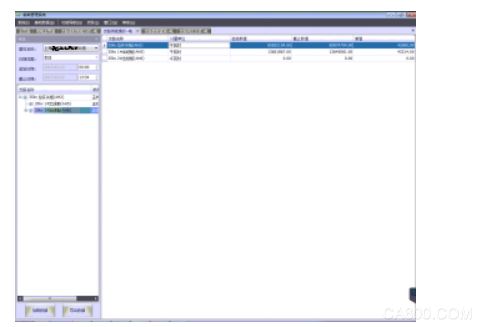
Classified energy consumption branch non-working daily energy
Statistics on working days and non-working days for each branch, and non-working days can be set flexibly through the system
Statistics can be exported to Excel;
Classified energy consumption branch year-on-year analysis
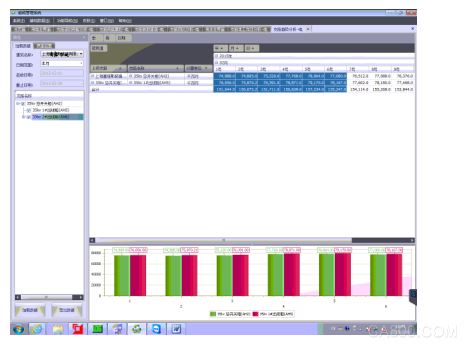
Statistics on the monthly energy use for each branch and the energy consumption for the same period last year;
Classification energy consumption branch energy use
Query the meter readings for any two branches of each branch and calculate the difference;
Time accuracy to minutes;
Analysis of Energy Consumption Trend of Classified Energy Consumption Branch
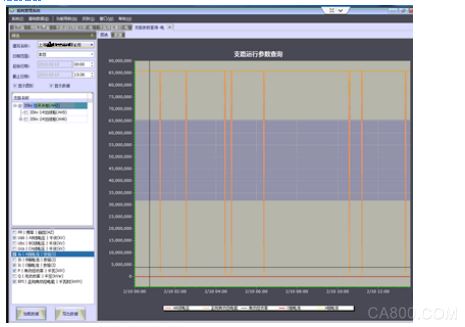
The energy consumption parameters (for example, voltage, current, power, power factor, etc.) of any branch can be queried during a certain period of time. The specific queryable parameters are related to the installed instrument and system configuration.
The data is displayed in the form of a chart or table. The chart can be zoomed in, zoomed out, or moved by mouse operation; the data can be sorted (maximum, minimum);
Data can be exported to Excel;
Configuration options
According to the relevant technical specifications, the basic information of the building is configured, such as: building function, building area, air conditioning area, building address, etc., in which the building area and other information will be used to analyze energy consumption per unit area;
Configure the basic information such as the type, model, and manufacturer of the instrument used in the project, and add the monitoring parameter information that can be provided by this type of instrument. Here, the configuration affects the energy consumption statistics, statistics of energy consumption over time, and parameter query functions;
All metering instruments used in the configuration project, save metering instrument address, transformation ratio, corresponding collector, code, monitoring circuit name and other information;
The information related to metering, proportioning, and calculation methods involved in configuring itemized energy consumption statistics can be flexibly configured according to the situation of the project. The configuration information here will affect the energy consumption analysis of each classification. ;
Configure the measuring instruments, computing methods, proportions, and department energy plans for each department's energy use. After completing this configuration, the department's energy consumption analysis module will be enabled.
Configure the meter, calculation method, and proportion of an energy use area in the building. After completing this configuration, the regional energy consumption analysis module will be enabled.
5. Prospects
According to the analysis of the energy consumption and operation effect of the Hongqiao No. 05 plot project, a typical energy consumption analysis model was established and analyzed.
Establish a building energy consumption measurement system, grasp the energy consumption of buildings, discover the shady energy consumption, and make more energy-saving changes. At the same time, we must consolidate the achievements of energy-saving reforms through management measures such as measurement fees and performance assessment.
Select energy-saving equipment (inverter, heat recovery device).
No matter how good the energy-saving equipment is, it cannot control the energy-saving effect even if it cannot control the waste. By increasing the automation energy-saving equipment, formulating equipment operation strategies, reducing human intervention, and centralizing the control, the energy-saving equipment is achieving energy-saving.
Through the same-ring analysis data provided by the energy consumption monitoring system, the results of energy-saving transformation are quantified and the energy-saving effect is maximized.
6. Concluding remarks
The total area of ​​large-scale public buildings is less than 4% of the total area of ​​urban buildings, but the total energy consumption accounts for 22% of the total electricity consumption in the country's cities and towns. The annual consumption of large-scale public buildings per unit area reaches 70 to 300KWh, which is 10 for ordinary residential buildings. ~ 20 times. Public buildings are major energy-saving and energy-saving targets. The energy-saving work of the Hongqiao No. 05 plot project is of great significance to promoting and stimulating energy conservation and achieving energy conservation and emission reduction targets.
About the author: He Meifang, female, Ankerui Electric Co., Ltd., the main research direction for the smart grid power distribution, Email: Contact: 021-69156950 QQ5 Inch Full Range,5 Inch Full Range Speaker,Neodymium Loudspeaker,5 Inch Loudspeaker
Guangzhou BMY Electronic Limited company , https://www.bmy-speakers.com