Application of Ankerui Energy Consumption Management System in Shanghai Baolin Electric Photovoltaic Project Phase I-Ankerui Cui Tingyu
Ankerui Cui Tingyu
Jiangsu Ankerui Electric Manufacturing Co., Ltd.
Abstract: After the 1970s, with the development of modern industry, the global energy crisis and air pollution problems have become increasingly prominent. Traditional fuel energy is declining day by day, and the harm to the environment has become increasingly prominent. At the same time, there are about 2 billion people worldwide. Less than normal energy supply. Solar radiation energy is an important energy source. It is an inexhaustible, inexhaustible, non-polluting, cheap, and freely available energy source for humans. Photovoltaic power generation is one of the effective ways to convert solar radiation into electrical energy. Photovoltaic power generation monitoring system is an important part of photovoltaic power generation. The photovoltaic power generation monitoring system collects, stores and displays related power by real-time monitoring of photovoltaic power generation equipment: combiner boxes, inverters, environmental monitors and intelligent monitoring instruments installed in important circuits Parameters to realize its intelligent management. This article briefly introduces the Acrel-2000 v8.0 photovoltaic power generation monitoring system used in the Minghua project in Inner Mongolia.
Keywords: Shanghai Baolin Electric Photovoltaic Project Phase I; Factory; Photovoltaic Energy Consumption Monitoring System; Ankerui Energy Consumption System; Inverter;
1 Introduction
The distribution of solar energy resources is related to the latitude, altitude, physical geography and climatic conditions of various places. my country's Tibet, Qinghai, Xinjiang, Gansu, Ningxia, and Inner Mongolia Plateau have the highest total radiation and sunshine hours in the country, which is one of the regions with rich solar energy resources in the world. The photovoltaic power generation site must have good lighting conditions and no shelter. In view of this characteristic, the photovoltaic power generation site area is relatively large. The real-time collection of parameters such as current and voltage during normal operation of the photovoltaic system is a key of the photovoltaic system. If manual inspection is used, it is time-consuming and laborious. The collected data has a certain time difference and cannot objectively reflect the overall system The overall operating status at the time of the mode. So a set of intelligent background power monitoring equipment is very important.
Ankerui Energy Consumption Management System is a photovoltaic power generation monitoring system developed by the manager in response to the above trends. This system monitors the inverter equipment of the first phase of the Shanghai Baolin Electric Photovoltaic Project in real time, and monitors the power parameters of the collector during the operation of the monitoring loop, and stores and analyzes them in the form of tables or graphs. The operation status of the entire measurement system is to find out the failure points of the system operation, and to improve maintenance efficiency, users can grasp the system operation status in real time and provide accurate data support.
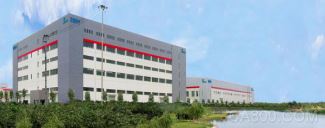
The first phase of the Shanghai Baolin Electric Photovoltaic Project is located at 1515 Jinshao Road, Baoshan District, Shanghai. It is invested by Shanghai Ankerui New Energy Co., Ltd. and uses the existing roof of the Shanghai Baolin Electric Group to construct the first phase of the 296.8kWp photovoltaic project on the A1 floor. Adopt 14 sets of 20KW string inverters.
Shanghai Baolin Electric Group is a modern high-tech enterprise with 15 years of research and development, manufacturing and sales of complete sets of high and low voltage electrical equipment. In response to the national call for energy conservation and emission reduction, a 296.8kWp photovoltaic project in the first phase of the A1 building was built on the roof of the existing factory.
Solar energy is a very clean energy. Its method of obtaining will not produce waste, exhaust gas, noise, smoke and dust, nor will it cause any pollution to water, air and ground. Photovoltaic power generation systems convert solar radiation into electrical energy through solar cells, which can be sent to the grid or stored in batteries, thereby providing humans with inexhaustible energy.
2 Design basis
"Technical Specification for Energy-saving Testing System for Public Buildings"
"Code for Electrical Design of Civil Buildings" (JGJ/T 16-2008)
"Intelligent Building Design Standard" GB/T50314-2006
"Code for Quality Acceptance of Intelligent Building Engineering" (GB/T50339-2003)
"Technical Guidelines for Evaluating Enterprise's Rational Use of Electricity GB"
"General Rules for the Preparation of Enterprise Energy Saving Planning
"Enterprise Energy Audit Technology General Rules-GB"
GBT23331-2009 "Energy Management System Requirements"
GB-50052-2009 "Code for Design of Power Supply and Distribution System"
u National and industry standards for energy consumption metering devices
DL/T 645-1997 Multi-function electric energy meter communication protocol
DL/T 645-2007 Communication protocol for multifunctional electric energy meter
GB/T 19582-2008 Industrial automation network specification based on Modbus protocol
4 System architecture
Ankerui energy consumption management system is networked according to the actual situation of the first phase of the Shanghai Baolin Electric Photovoltaic Project. The overall network structure is directly connected to the collector of the fire control center using a shielded twisted pair, and then the data is uploaded to the server through the network on.
The system mainly adopts a hierarchical distributed computer network structure, as shown in the system structure diagram: station control management layer, network communication layer and field equipment layer.
The field equipment distribution of the first phase of the Shanghai Baolin Electric Photovoltaic Project is as follows:
14 inverters; 1 grid-connected cabinet.
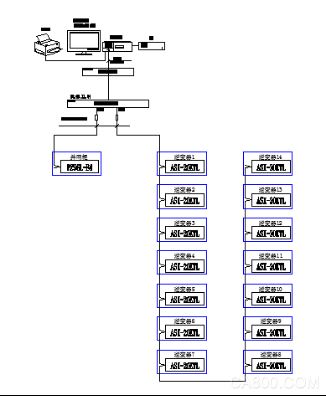
System structure diagram
5 System software module
Comprehensive energy consumption display
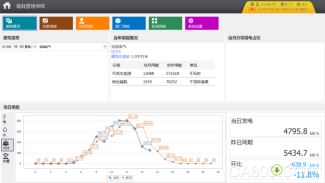
Ankerui energy consumption management system successfully logged in and entered the main page. The main page displays the building picture, basic information of the building, a pie chart of the electricity consumption of the building in the current month and the power generation of various energy sources. According to the selected project, load its project picture, you can select the time to view the energy consumption of the project, and automatically refresh after selecting the building or time. The default is the current day.
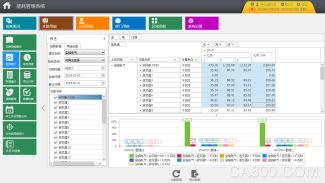
Overview of branch energy consumption
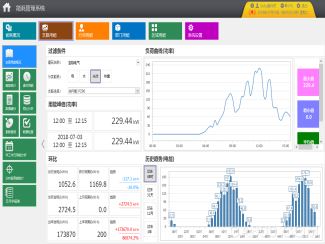
Ankerui energy consumption management system can query the energy consumption according to the branch name of the classified energy consumption, and display the peak power generation of the current day and the current month (the maximum power value of electric energy), the power generation of the current day, the current generation of the current month, the current generation of power, and the same period of yesterday’s power generation. Comparison of power generation in the same period of the month and the same period of the previous year; the energy consumption of the past 48 hours, 31 days, 12 months, and 3 years is displayed in a bar graph; the load energy consumption trend of 15 minutes is displayed in a graph (inverter display Power curve, flow meter display flow rate curve), and display the current value, the maximum and minimum within 15 minutes.
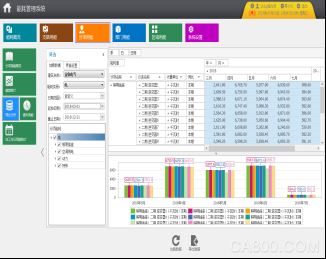
Branch energy

Ankerui energy consumption management system can count the energy consumption of each branch within a certain period of time, day by day, week by week, month by month, season by season, and year by year. Select the branch that needs to be queried, click "Load Data" to view the energy consumption trend of each branch, query according to the existing date or custom time, and display the total energy consumption of the branch in the form of a chart.
Itemized energy consumption overview
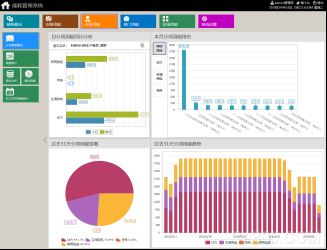
Ankerui energy consumption management system can perform energy consumption statistics and display according to items. Among them, the daily sub-item energy consumption year-on-year analysis chart shows the current and yesterday energy consumption histograms of different sub-items (blue bars indicate today, green bars indicate yesterday); energy consumption pie charts show the energy consumption of each sub-item in the past 31 days Ratio; the stacked graph shows the energy consumption trend of each sub-item in the past 31 days; the sub-item energy consumption ranking graph shows the top 10 branches corresponding to the energy consumption value of the selected sub-item.
Itemized energy
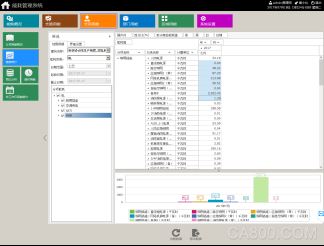
Ankerui energy consumption management system can count the energy consumption of each sub-item within a certain period of time, day by day, week by week, month by month, season by season, and year by year. Select the branch that needs to be queried, and'load data' to view the energy consumption trend of each branch in the sub-item, and query according to the existing date or custom time. The branches here are all configured through the classification and sub-items in the basic data, and the default query is the energy consumption of the current month.
Analysis of energy consumption data year-on-year
The Acrel-5000 photovoltaic energy management system can analyze the power generation of each inverter with the value of the same period last year and the value of the previous month to verify the power generation effect.
Chart export
Acrel-5000 photovoltaic energy consumption management system can export analysis results, drawn graphs and tables to Excel.
User Management
Ankerui energy consumption management system user authority management adopts a hierarchical mode, with three levels of system administrators, logistics managers, and equipment maintenance personnel. All operations are automatically recorded with time stamps, which can establish good anti-accident measures.
In order to ensure the safe and stable operation of the real-time system, the entire system provides reliable safety protection measures. All system operators can assign certain characteristics according to the authority. These characteristics stipulate the scope of application of each operator to the system and various activities, such as users Name, password, operation authority and operation range and other characteristics.
6 Conclusion
Ankerui energy consumption management system is applied in the first phase of the Shanghai Baolin Electric photovoltaic project, which can realize real-time monitoring of the equipment in the Inner Mongolia Minghua photovoltaic power generation system. It can not only display the operating status of the equipment, but also measure the power generation, limit alarms, etc. Features. The design, installation, and commissioning of the system are also a detailed review of the entire power generation system. The design conforms to the on-site system topology diagram and related software interfaces, so that managers can quickly grasp the operating status of the entire system. The system also converts photovoltaic power generation into standard coal and related parameters such as carbon dioxide emissions.
Complete, reliable and stable, it provides accurate data basis for the management and fault traceability of photovoltaic power generation managers.
references:
[1]. Technical requirements of the Ministry of Housing and Urban-Rural Development
[2]. "Technical Guidelines for Large-scale Public Construction, Jianke [2008] No. 114"
About the author: Cui Tingyu, male, undergraduate, Jiangsu Ankerui Electric Manufacturing Co., Ltd., whose main research direction is intelligent building power supply and distribution monitoring system. Email: el.cn QQ: 2881068608 Mobile: 18860995251 Tel: 0510-86179851 Fax: 0510-86179975 Website: http://
Light Stand,Ring Light Stand,Photo Studio Light Stand,Mobile Phone Tripod Stand
SHAOXING COLORBEE PLASTIC CO.,LTD , https://www.colorbeephoto.com